The Science
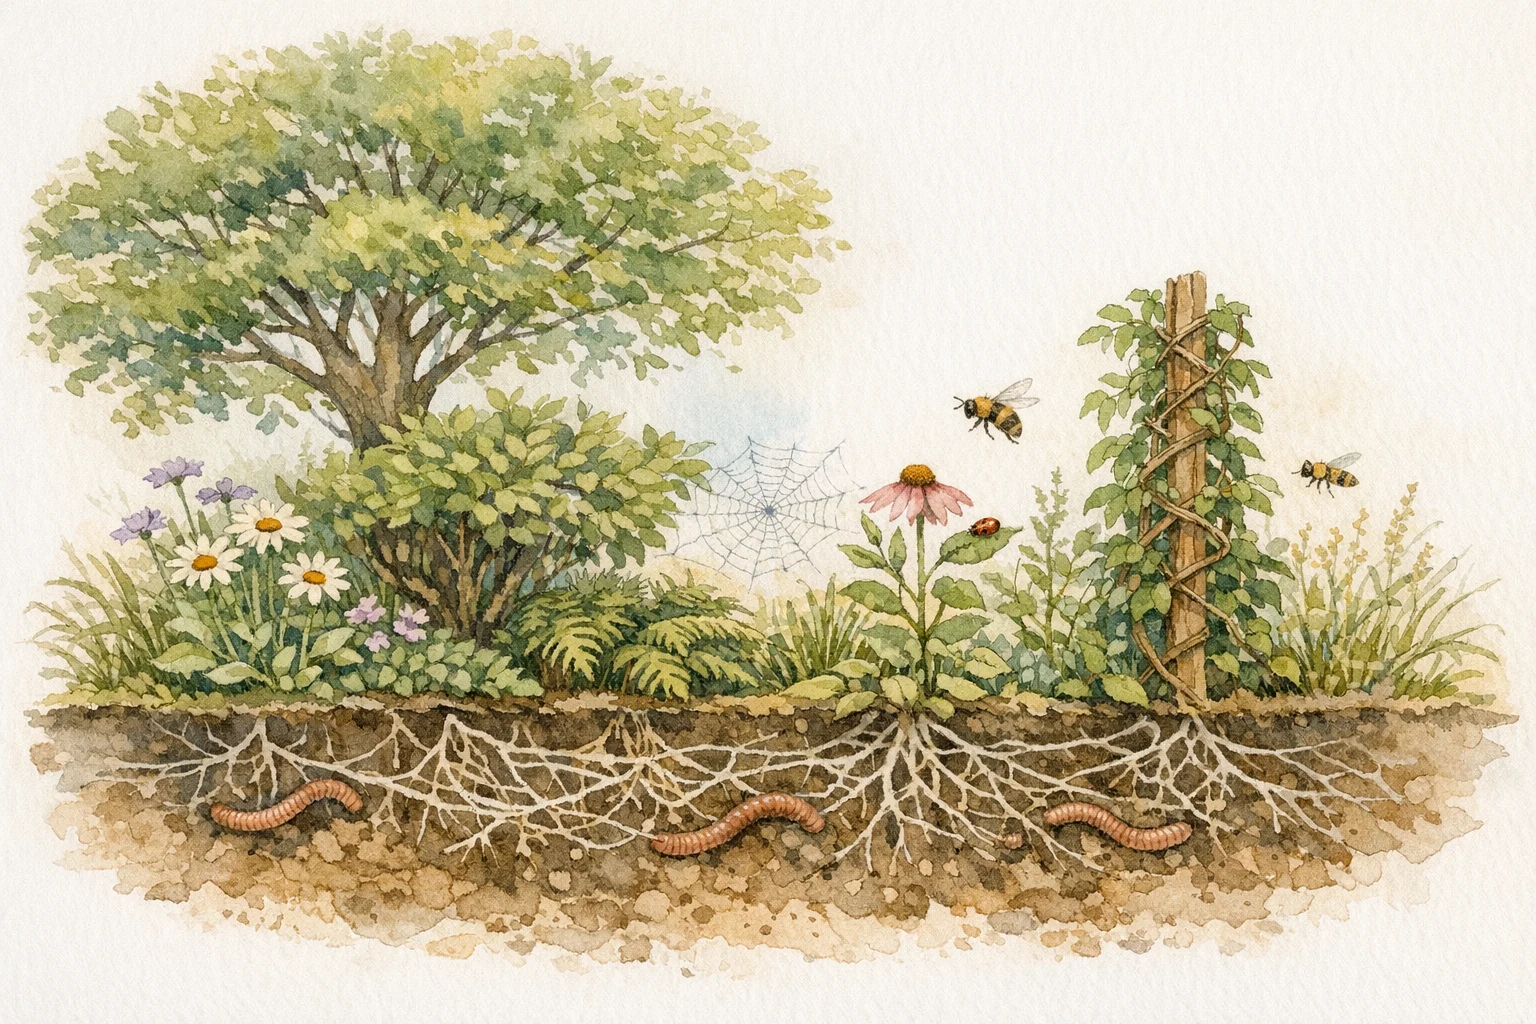
A healthy garden is rarely built from repetition alone. It works best when different plants do different jobs.
But repetition is one of the oldest instincts in agriculture.
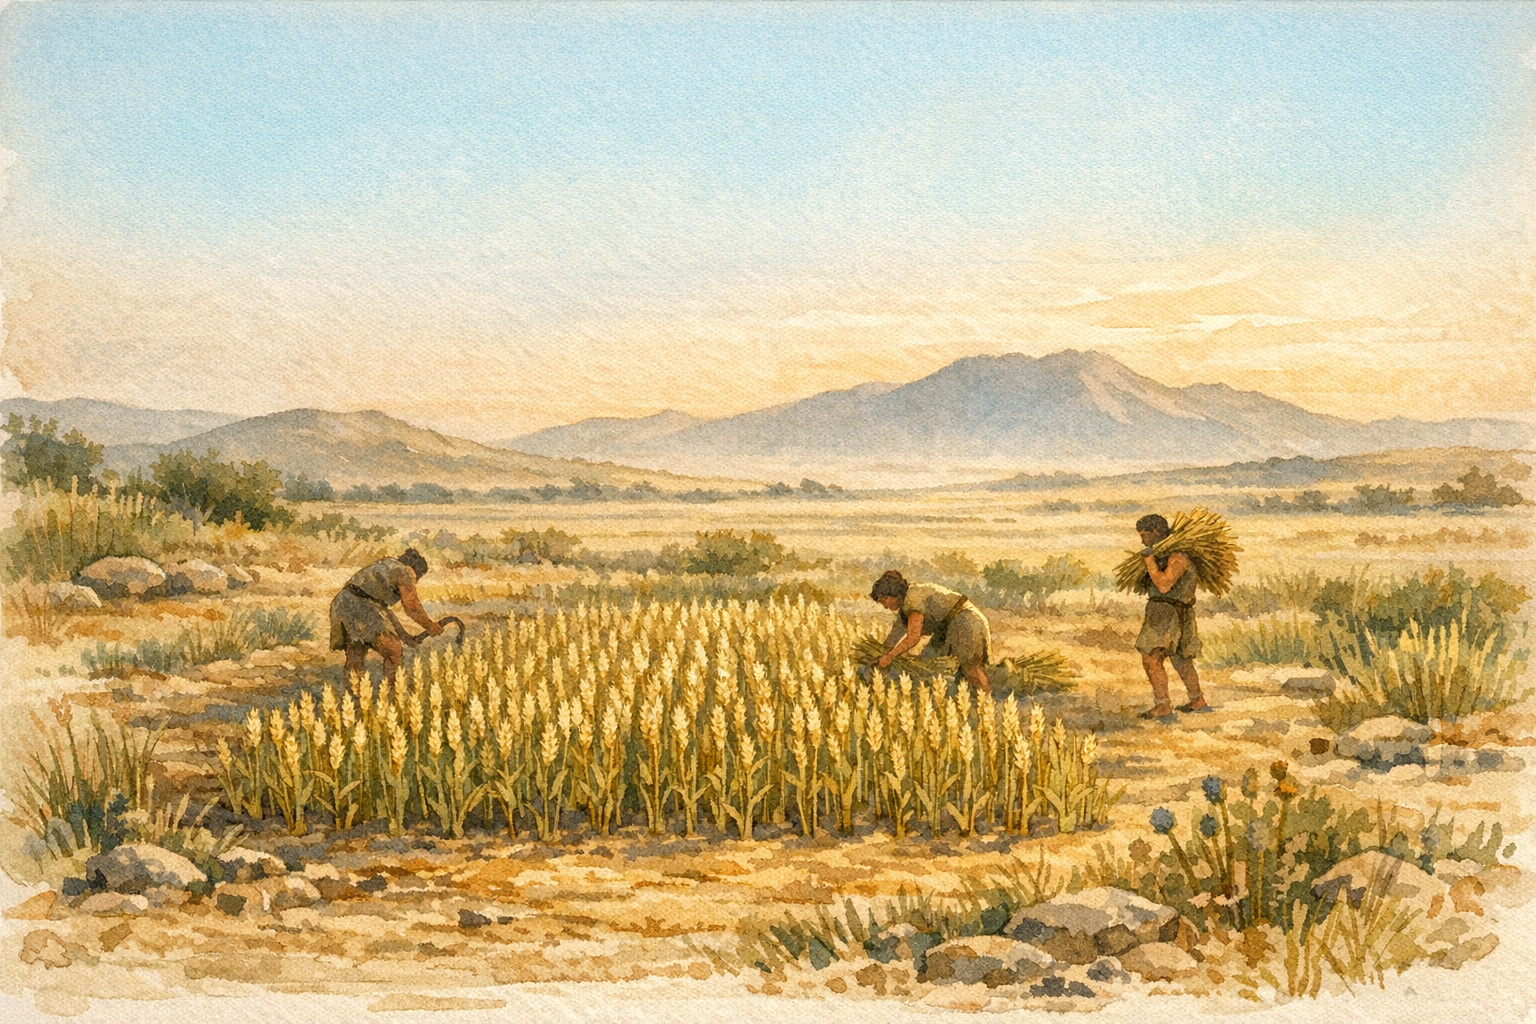
From the beginning, grain farming, for example, rewarded a simple move: choose one promising seed and grow more of it. Einkorn was domesticated from wild populations in the Karacadağ mountains of southeastern Turkey (Heun et al. 1997), and newer genomic work describes it as likely the first domesticated "wheat" (Ahmed et al. 2023). From beginnings like that came a powerful agricultural habit: repeat the same crop, simplify the field, scale the harvest.
Monocultures made practical sense, and they still appeal in gardens too. A rose border, a drift of lavender, a neat row of identical tomatoes, a lawn with one clean texture — repetition is visually satisfying. It feels orderly. It lets us give the whole space over to one favourite plant.
Ecologists, though, kept finding the opposite pattern in living systems. Diversity was not just variety for its own sake. It typically made communities more stable, resilient, and able to flourish.
Once you see diversity as enabling structure rather than clutter, the design logic changes. The question stops being "which plant do I want more of?" and becomes "which combination of plants is likely to hold together better?" That shift sits behind companion planting, permaculture, and regenerative agriculture.
The principle is simple. The practice is not. Designing plant communities scientifically and skilfully usually takes years of observation, trial, and ecological knowledge. Olier AI seeks to lower that barrier.
Any gardener can choose a handful of plants from our library of 39,000+ species and ask a simple question: are these plants likely to flourish together as a more diverse, resilient community? Olier draws on decades of ecological data to answer.
Five Dimensions
We measure five dimensions of diversity. Each has its own science — its own landmark studies, its own surprises. Together, they paint a picture of how a garden holds itself together.
Phylogenetic diversity — how far apart your plants sit on the tree of life — turns out to be one of the strongest cross-metric indicators. Plants with distant evolutionary histories share fewer pests, host different soil fungi, support different pollinators, and fill different physical niches. It is our broadest summary signal. But each dimension tells its own story, and each story is worth knowing.
Phylogenetic Diversity
Distant relatives make better neighbours.
Measured with Faith's Phylogenetic Diversity across a 39,000+ species evolutionary tree
Structural Diversity
The more layers your garden has, the more life it can hold.
Measured with Shannon's entropy across 12 growth forms from the World Checklist of Vascular Plants
Soil Biodiversity
Beneath the ground, invisible communities are at work.
Fungi and bacteria — mycorrhizal partnerships, disease suppression, and nitrogen fixation
Predator Diversity
Diverse predators cover each other's blind spots.
11 functional groups — from ground beetles to parasitoid wasps to insectivorous birds
Pollinator Diversity
Different flowers need different visitors — at different times.
13 functional groups — from bumble bees to hoverflies to nocturnal moths
And Then: Your Location
We check each plant against your local conditions — climate, rainfall, soil — and rate suitability from Ideal to Not Recommended. Then Smart Garden goes spatial: sun angles, shadow zones, auto-placement. Your guild, optimised for your plot.
Biological Allies
Four Proven Allies
Plant guilds do not stand alone. They are also shaped by bacteria and fungi in the soil and on plant surfaces. Our philosophy is ecological first: build stronger plant communities, then reinforce them, where needed, with proven allies that can help suppress disease and pests.
Data Sources
Making scientific databases accessible to everyday gardeners.
Taxonomy & Traits
WCVP
Kew Gardens' authoritative global taxonomy — accepted species with lifeform classifications. The backbone of our structural diversity scoring.
TRY Database
A major global plant trait database — functional traits and growth forms assembled from hundreds of contributed datasets worldwide.
AusTraits
Comprehensive trait records for Australian plant taxa — filling gaps in global databases for Australian flora.
GIFT
Global Inventory of Floras and Traits — growth forms and life forms with confidence scores. Fills gaps where WCVP coverage is incomplete.
EIVE
Ecological Indicator Values for Europe — light, moisture, and nutrient requirements, extended via machine learning to species outside the original dataset.
Ecological Networks
GloBI
Global Biotic Interactions — who eats whom, who pollinates whom, across the tree of life. The backbone of our guild scoring.
FungalTraits
Fungal genera classified by expert mycologists — beneficial mycorrhizae, plant pathogens, and biocontrol fungi.
FungalRoot
Species-level mycorrhizal type classifications. Combined with Brundrett & Tedersoo 2018 family-level rules to achieve full coverage of our guild-ready species.
Location & Climate
GBIF & iNaturalist
Where plants actually grow. Occurrence records tell us where each species has been observed in the wild — the foundation of our suitability scoring.
WorldClim, AgroClim & SoilGrids
Temperature, moisture, and soil conditions sampled at each species' occurrence locations — how we know what climate and soil each plant prefers.
Ecological Frameworks
CSR Framework
Every plant has a survival strategy. In the 1970s, ecologist J.P. Grime identified three fundamental approaches:
Fast growers that dominate in good conditions. Think nettles, brambles, or sunflowers.
Hardy survivors in harsh environments. Think heather, cacti.
Quick colonizers of disturbed ground. Think dandelions, poppies.
Arrow to C
This arrow means more competition: neighboring plants suppress each other more strongly when productivity is high and disturbance stays low.
Arrow to S
This arrow means more stress: drought, cold, low nutrients, poor oxygen, or off-optimum pH limit growth below its potential maximum.
Arrow to R
This arrow means more disturbance: repeated biomass destruction from mowing, trampling, grazing, fire, cultivation, or other damage.
Following Bill Shipley's framing, these arrows are environmental gradients, not plant virtues. They show which pressure becomes more important as you move toward each corner of the triangle.
From Theory to Calculation
We calculate each plant's CSR scores using StrateFy (Pierce et al. 2017), which derives strategies from three leaf traits: leaf area, specific leaf area, and leaf dry matter content. Real plants rarely fit neatly into just C, S, or R — so we classify them into one of 19 Hodgson types (Hodgson et al. 1999). A plant might be "S/CSR" (mostly stress-tolerant but somewhat balanced) or "C/CR" (competitive with ruderal tendencies). This precision matters for care recommendations.
From Strategy to Care
We look at the dominant strategies across your guild to classify it and generate care advice:
Fertile Garden Guild
Rich soil, regular watering, pruning to control spread
Low-Input Guild
Tolerates poor soil and neglect — avoid over-watering
Pioneer Guild
Short-lived plants that self-sow — plan for turnover
All-Rounder Guild
Adaptable plants — standard garden care is sufficient
From Strategy to Garden Services
We do not show ecological terms directly. We translate them into garden effects you can use. The underlying framework comes from Shipley's ecosystem-service model, but the output is written as practical questions: how much useful mulch a plant gives you, how much it depends on fertile soil, and how much carbon it stores in the plant and in the soil.
Some of these signals are height-based, some are CSR-derived, and one comes from whether the plant can fix nitrogen with microbial partners. The important step is the translation: the ecology stays under the hood, but the gardener sees what those processes mean in practice.
How the translation works
Height + CSR + nitrogen fixing
Raw ecological inputs from traits, plant size, and nitrogen-fixing ability.
Ecosystem processes
Biomass, decomposition, nutrient turnover, nutrient loss, and stable soil carbon.
Garden services
Mulch, low-input feeding, nutrient efficiency, and carbon storage you can plan around.
Mulch & Habitat
How much useful plant material you get, and how long it lasts on the ground.
Biomass Output is our estimate of how much material a plant makes each year. In the Encyclopedia, this is linked to mature height: taller plants usually produce more annual material.
Litter Persistence comes from CSR. In ecology this starts as decomposition rate, but we flip it into gardener language because what matters here is how long fallen leaves and stems stay useful on the ground. High persistence means slower breakdown.
In the current model, C and R plants tend to break down faster, while S plants tend to leave tougher litter for longer. In practice, this tells you whether a plant gives quick soil feed, longer-lasting mulch, or a mix of both.
Fertiliser Needs
How much a plant depends on fertile soil, and whether nutrients stay in your garden.
Nitrogen Fixer is not a CSR score. It is a separate biological signal from the TRY database that marks plants able to bring new nitrogen into the system with microbial partners.
Nutrient Turnover describes how quickly nutrients move through the loop of soil, plant, litter, and back to soil. Nutrient Loss asks a different question: do those nutrients stay on your site, or do they escape through leaching or removal of dead biomass?
That is why this card is useful in garden language. Two plants can both move nutrients quickly, but one may recapture them well and another may let them leak away. This is the reasoning behind the Encyclopedia's practical verdicts: frugal, hungry but efficient, or hungry and wasteful.
Carbon Storage
Carbon locked in the living plant, and carbon that becomes stable soil humus.
Living Biomass is the visible carbon pool: wood, stems, branches, and roots. In the Encyclopedia, this is height-based, which is why large plants usually store much more carbon while they are alive.
Long-term Soil Carbon is the CSR-derived part of the card. It estimates how much fallen material is likely to end up as stable soil humus rather than cycling back quickly into the air and soil.
In the current explanation, this is linked to recalcitrant leaf carbon: slower-breaking, tougher litter contributes more to long-lasting soil carbon. So one plant may store more carbon in its living structure, while another contributes more to the slower soil-building pathway.
The goal is not to foreground abstract strategy labels. It is to show how plant strategy becomes a garden outcome you can actually plan around.
Known Limitations
The Data Scarcity Problem
Our scoring system has a bias we want you to know about: plants with more data score higher.
A well-studied European crop like wheat has thousands of recorded interactions in GloBI. A rare tropical fruit tree might have only a handful. When we calculate pest networks or biocontrol potential, the data-rich plant looks "better" simply because we know more about it.
What this means in practice:
- • Temperate European/North American plants often score higher
- • Tropical species (especially from Africa, Southeast Asia) may be underweighted
- • Common crops beat rare but excellent companion plants
We're actively working to address this through machine learning imputation and by incorporating more tropical databases. But for now, treat scores as "what the data shows" — not absolute truth.
The Global Data Problem
Our species interaction data comes from studies conducted worldwide — not specifically from your garden.
This is partly by design. Our scoring measures functional group diversity — whether your guild attracts ground beetles, parasitoid wasps, hoverflies, and nocturnal moths as broad categories, not whether it attracts Coccinella septempunctata specifically. Functional groups are far more robust than individual species: most terrestrial ecosystems support ground beetles, parasitoid wasps, and hoverflies in some form. The specific species differ by region, but the ecological roles they fill are remarkably consistent.
That said, two real limitations remain:
- • Functional group presence doesn't guarantee functional group activity. A plant documented as attracting parasitoid wasps in European field trials will likely attract local parasitoid wasps in your garden too — but those local wasps may not parasitize the particular pest you're dealing with.
- • The data behind functional group assignments is geographically skewed. The studies linking plants to their associated predator and pollinator guilds come disproportionately from temperate Europe and North America. A tropical plant may host equally diverse functional groups, but if fewer studies have documented them, it scores lower.
Think of our scores as probability indicators at the functional group level: a guild that spans many predator and pollinator groups has structurally better odds of recruiting local beneficial organisms — but local ecology and your observant eye always have the final say.
The people behind the science
The research matters, but so do the people who interpreted it, tested it, and built it into Olier. Meet the people behind the platform.
Go to PeopleHow It All Comes Together
From decades of plant ecology research to instant, personalized guild recommendations for your garden.
Try the Guild BuilderSelected References