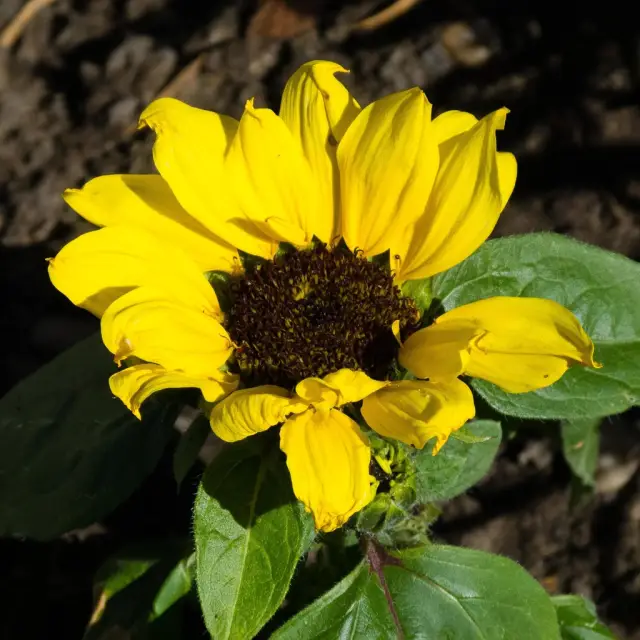
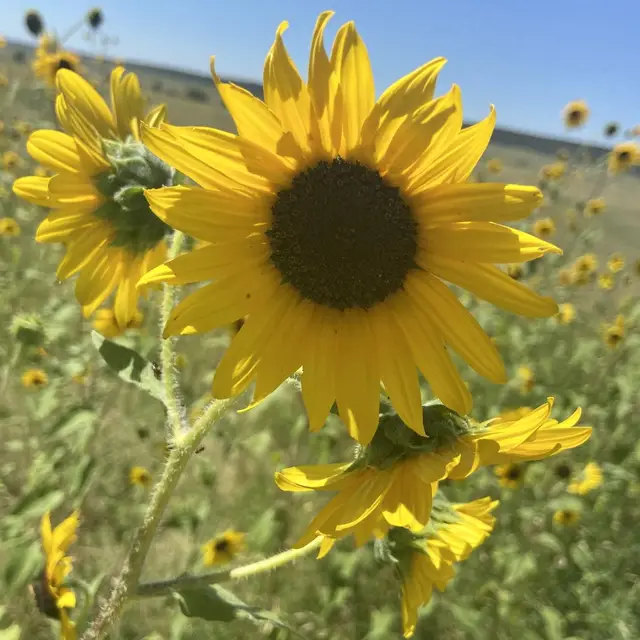
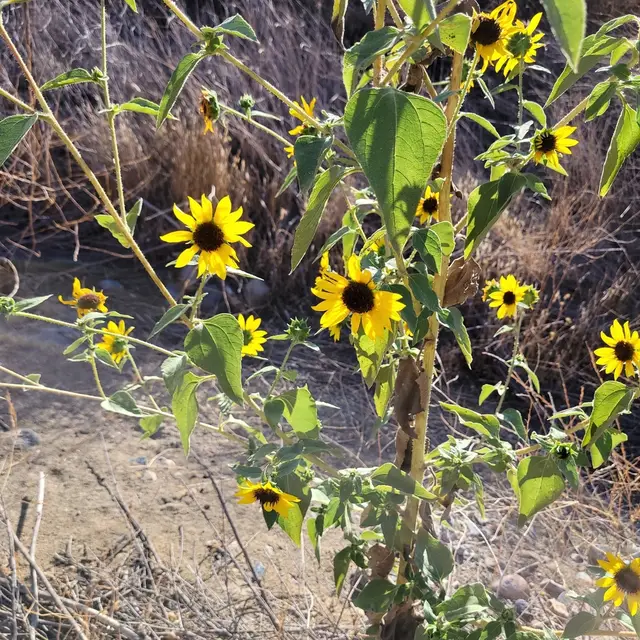
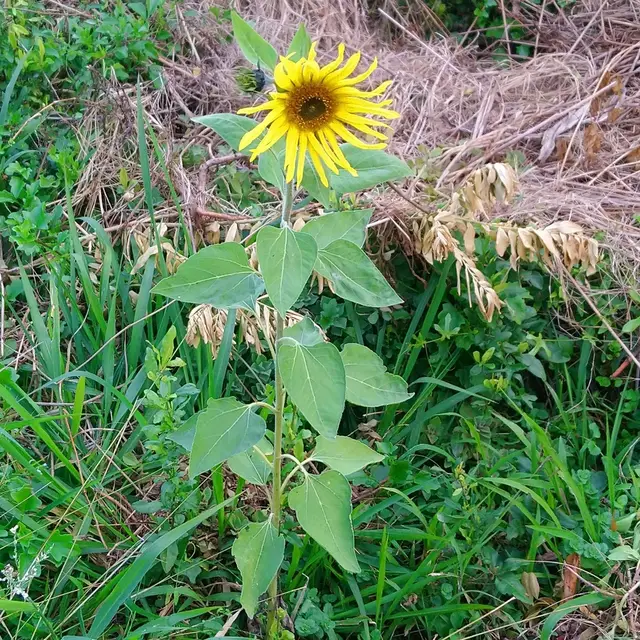
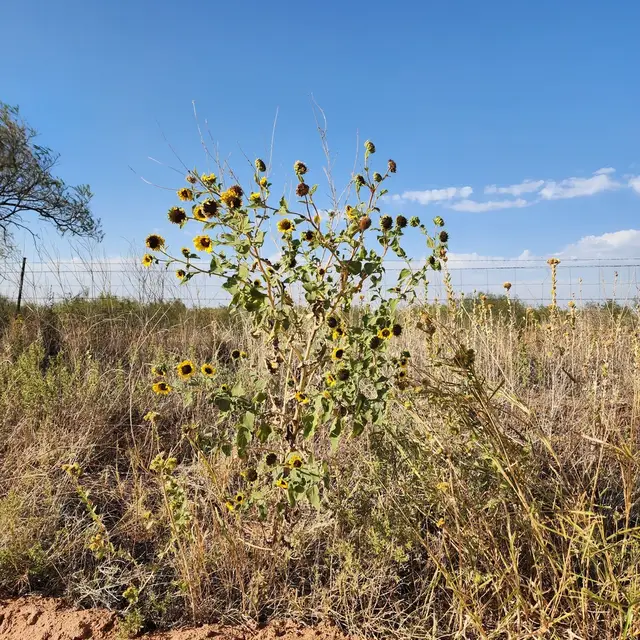
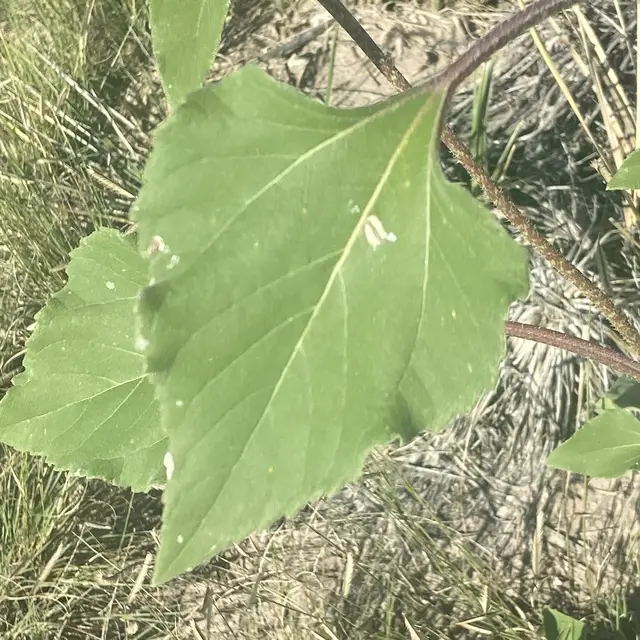
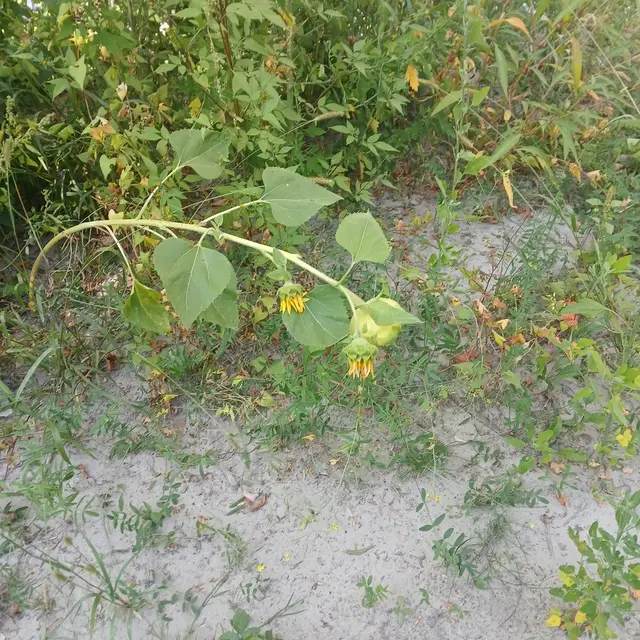
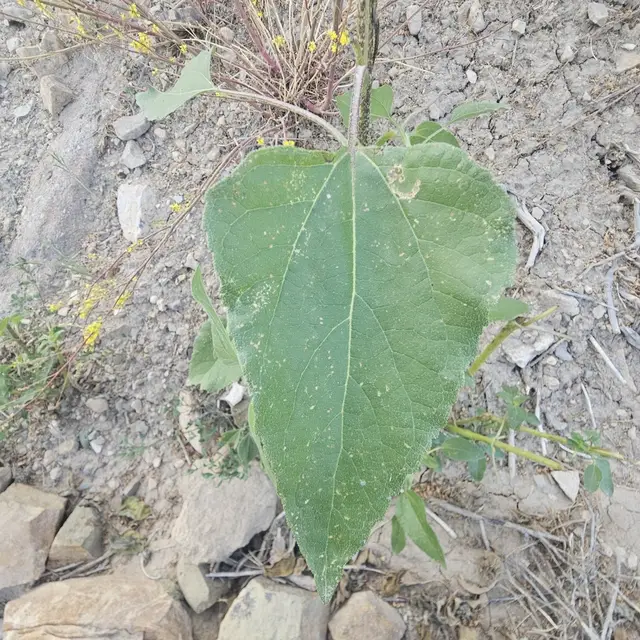
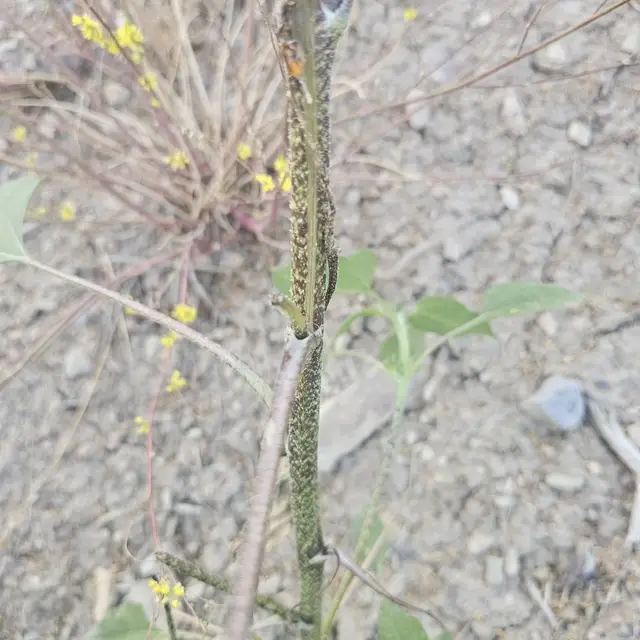
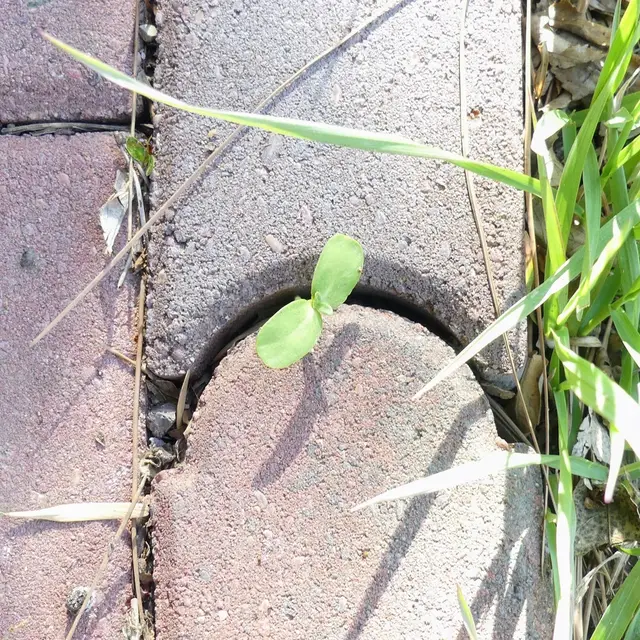
Helianthus annuus
Herb / Forb
How would you like to explore?
Check Your Location
Will this thrive in your garden? Get personalized growing advice.
Full Profile
Full details on natural growing conditions, botanical profile and interactions.
Build a Guild
Find companion plants that work together.
"Good gardening starts with understanding how plants live in nature." Learn more →
We believe good gardening starts with understanding how plants live in nature—not as isolated individuals, but in the wild as members of a living network that includes plants, fungi, insects and environmental conditions.
When you look up a plant here, we invite you to think about its natural home. What soil and climate does it prefer? What grows alongside it? While we can't perfectly recreate nature in our gardens (and sometimes that's a good thing—for example, competition often keeps plants out of the best spots!), knowing these natural preferences gives you a helpful starting point.
We also help you consider not just what a plant needs, but how it can serve your garden and the wider ecosystem, and which plants and fungi make good companions—because a well-chosen neighbour can make all the difference.
In partnership with Professor Emeritus Bill Shipley, we try to keep everything grounded in observations from major databases and calculations from established ecological theories. If you spot something that could be improved, we'd love to hear from you at [email protected]
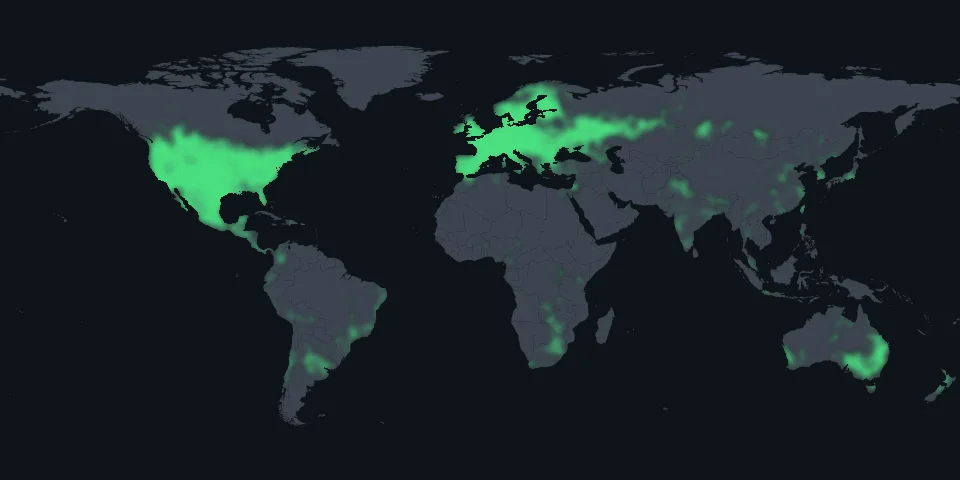
Location Compatibility
Check if Helianthus annuus suits your climate
Detecting your location...
Or click the map to set it manually
Profile
Ornamental Sunflower · Mirasol · Annual Sunflower · Common Sunflower · Sunflower
向日葵 · 向日葵
Taxonomy: World Flora Online · Mean trait values: TRY Database · Vernacular names & photos: iNaturalist (CC0 / CC-BY only)
Growth Strategy
Vigorous grower that bounces back from cutting, digging, or trampling. Good for high-traffic areas.
What is CSR?
Competitors (C) invest in rapid growth to capture resources and outcompete neighbours.
Stress-tolerators (S) conserve resources and endure harsh conditions through slow, steady growth.
Ruderals (R) reproduce quickly and colonize disturbed ground, completing life cycles rapidly.
CSR: Grime (1977) · Calculated using StrateFy (Pierce et al. 2017)
Human Uses
Human food
- oil/fat
PROTABASE, the information base of PROTA (Plant Resources of Tropical Africa) (on-line resource).
- pseudocereal
PROTABASE, the information base of PROTA (Plant Resources of Tropical Africa) (on-line resource).
- seeds
PROTABASE, the information base of PROTA (Plant Resources of Tropical Africa) (on-line resource).
- starch
PROTABASE, the information base of PROTA (Plant Resources of Tropical Africa) (on-line resource).
Environmental
- ornamental
Encke, F. et al. 1993. Zander: Handwörterbuch der Pflanzennamen, 14. Auflage
Materials
- fiber
PROTABASE, the information base of PROTA (Plant Resources of Tropical Africa) (on-line resource).
- lipids
PROTABASE, the information base of PROTA (Plant Resources of Tropical Africa) (on-line resource).
Fuels
- petroleum substitute/alcohol
International Energy Agency. 2004. Biofuels for transport: an international perspective. Oklahoma invasive Plant database 1-216.
potential
Medicines
- folklore (traditional)
Duke, J. A. et al. 2002. CRC Handbook of medicinal herbs
Nutritional Profiles (1 form)
Seeds, sunflower seed kernels, dried
Source: USDA FoodData Central SR Legacy. %DV based on FDA Daily Values (2020).
Data from USDA GRIN, Duke Ethnobotany for reference only. Many plants have toxic parts, require specific preparation, or have unverified traditional uses. Consult qualified experts before consumption or medicinal use.
In the Wild
How is this calculated?
Ecological Indicator Value for Europe (EIVE-L) from field surveys of European vegetation — shows typical light conditions where this species is found in natural habitats under competition.
Based on occurrence data: values show typical conditions where populations grow (median), with range showing mildest to most extreme locations.
Based on occurrence data: values show typical conditions where populations grow (median), with range showing variation across locations.
Deep profile (0-200cm) harder to amend
Based on occurrence data: shows where plants grow after competition — many species tolerate richer soils than where found.
Soil/root-zone moisture signal from EIVE-M (Ecological Indicator Values for Europe, moisture axis), harmonised from European vegetation survey data following Dengler et al. (2023). This describes the edaphic moisture regime where the plant is typically found, not rainfall and not a direct drought-tolerance score.
Climate: WorldClim 2.1 · Agroclimate: Copernicus C3S · Soil: SoilGrids 2.0 · Indicators: EIVE (Dengler et al. 2023) · Occurrence: GBIF
Living Network
Pollinators
7 pollinator groups documented
Led by Bumblebees, Butterflies, Long-reach Bees, and Small Bees.
Bumblebees
8Butterflies
5Long-reach Bees
3Small Bees
3Honey Bees
2Hoverflies
1Moths
1Grouped by visiting pollinator type rather than individual species.
The science behind thisEcosystem Services
Mulch & Habitat — the science
How much material this plant produces each year. Calculated from maximum height using allometric scaling: NPP ∝ Height2.84 (Enquist & Niklas 2001). Taller plants produce proportionally more biomass.
How long fallen leaves and litter last on the ground. Derived from Grime's CSR plant strategy model (CSR scores calculated via StrateFy, Pierce et al. 2017). Competitors (C) and Ruderals (R) produce thin, nutrient-rich leaves that decompose fast. Stress-tolerators (S) produce tough, waxy leaves that resist breakdown. We invert the decomposition rate so that high persistence = slow decomposition — meaning the litter sticks around longer as mulch or wildlife habitat.
Decomposition CSR: C = high · S = low · R = high
Read full science behind →How much mulch does this plant produce, and does it last?
Fertiliser Needs — the science
These metrics predict how much a plant depends on soil fertility. This card uses one natural nitrogen-input override and two nutrient-flow indicators derived from Grime's CSR plant strategy (CSR scores calculated via StrateFy, Pierce et al. 2017): how fast nutrients move through the system, and how much of that nutrient escapes your site.
Whether this plant makes its own nitrogen via bacterial symbiosis (Rhizobium in legumes, Frankia in alders). These are the only natural inputs of new nitrogen into an ecosystem. Nitrogen fixers feed both themselves and their neighbours — free fertiliser.
How fast nutrients move through the soil → plant → litter → soil loop. The more rapidly biomass is produced and litter decomposes, the faster nutrients cycle. Both C-type (big, fast-growing) and R-type (fast but short-lived) plants cycle quickly. S-type plants cycle slowly — tough tissues resist breakdown. Shown in neutral colour because fast turnover is not inherently good or bad on its own.
CSR pattern: C = high · S = low · R = high
How much nutrient physically leaves your site — through leaching or removal of dead biomass. At the C-end, large standing biomass keeps loss low by recapturing released nutrients quickly. At the R-end, frequent disturbance (density-independent death) breaks that recapture loop, so rapidly released nutrients often leach away before the plant can use them again. High loss = nutrients drain from your garden. Colour is inverted: low loss = green.
CSR pattern: C = low · S = low · R = high
What this means for your garden:
| Strategy | Turnover | Loss | Verdict |
|---|---|---|---|
| C | High | Low | Hungry but efficient |
| R | High | High | Hungry and wasteful |
| S | Low | Low | Frugal — suits poor soil |
Worst case: high turnover + high loss + no N-fixing — constant nutrient drain with no free replacement. In Shipley's explanation, "capture" is the mechanism behind low loss, not a separate displayed metric on this card.
How much does this plant depend on soil fertility?
Carbon Storage — the science
Carbon storage has two components: carbon locked in the living plant, and carbon that persists in the soil long after leaves fall.
How much CO₂ is locked in the living plant (trunk, branches, roots). Scales as Height3.79 (Enquist & Niklas 2001) using the IPCC default of 0.47 g carbon per g dry biomass. A large tree stores orders of magnitude more carbon than a small herb.
How much carbon ends up as stable soil humus. From Grime's CSR model: the slower litter decomposes, the larger the proportion that becomes recalcitrant carbon — stable organic matter that persists in soil for decades. Stress-tolerators (S) produce tough, high-lignin tissues that resist breakdown, building the most stable soil carbon.
Recalcitrant CSR: C = low · S = high · R = low
Read full science behind →How much CO₂ does this plant lock away?
Shipley (2025) · Grime (2001) CSR model · StrateFy: Pierce et al. (2017) · Enquist & Niklas (2001) · TRY Database
Working with Other Plants
A lower-layer companion
Fills the lower layer close to the soil surface, where cover and spacing matter most. It also has unusually broad documented value for pollinators. The main management question is whether nearby plants still have enough room.
Garden role
Lower layer
Use it low in the planting, where it can fill space without being buried by taller companions. Expect more light below it after leaf drop.
Pathogen overlap with Helianthus(Asteraceae)
How likely each nearby genus is to share diseases with Helianthus. Stacking too many high-risk genera in one bed makes disease spread more likely.
Disease sharing probability (Gilbert & Webb 2007). Higher = more likely to share pathogens.
The science behind thisWhat It Brings
Occupies the lower layer
This plant sits low in the bed, where it can help fill space near the soil surface if its growth habit is dense enough.
Why: life form: herb · short-lived annual habit · deciduous · 1.4 m tall
Feeds many pollinators
Documented pollinator records suggest this plant may help support flower-visiting insects when it is in bloom and locally accessible.
Why: 7 pollinator groups documented; Led by Bumblebees, Butterflies, Long-reach Bees, and Small Bees
Supports natural enemies
Documented predator associations suggest this plant may help support pest-hunting organisms, though local benefit depends on season, habitat, and nearby prey.
Why: 3 predator groups documented; Led by Leaf pest specialists, Leaf-roaming predators, and Ground hunters
Watch and Manage
Can crowd its neighbors
Give neighboring plants real root and canopy space so this plant does not take more than its share of the bed.
Why: competitor-leaning CSR type (C/CR) · 1.4 m tall
Can reseed into open gaps
Expect volunteer seedlings where the bed opens up. Keep the ones you want, and thin the rest before the planting drifts too far from plan.
Why: dispersal modes: ant movement, gravity
Close relatives can stack pest pressure
Avoid making the bed mostly Helianthus species (the genus) or other Asteraceae family plants. Mixing in companions from other genera and families lowers the chance that one pest or disease issue runs through the whole planting.
Why: same-genus and same-family plants are more likely to share pests and diseases
Build a Guild Around It
Start Guild Builder with this plant and see climate-based sample guilds right away.
CSR strategy: Pierce et al. (2017) · Interactions: GloBI
Community Reports
Real growing experiences from gardeners around the world
Licensed under CC BY-NC 4.0