The Science
Light & Shade
Every plant has a light personality. Some crave full sun. Others thrive in the shadow of taller neighbours. Getting this right is one of the most important things you can do for a garden.
The Ellenberg Light Scale
In the 1970s, the German botanist Heinz Ellenberg did something remarkably practical. He walked through the forests, meadows, and wetlands of Central Europe and asked: how much light does this species actually live with?
Not how much it could tolerate in a lab. But how much light reached it in the wild, competing with every other plant for its spot. He scored each species from 1 to 9 — a Light number — based on brightness relative to an open field.
Even-numbered values fall between these anchors. "x" means indifferent — broad amplitude across light conditions.
Why This Matters
Ellenberg's values tell you not just what a plant can survive, but where it actually wins. This is the realized niche — where a species thrives after competition. Many shade-tolerant trees could grow in full sun, but they're outcompeted there.
For gardeners, this is exactly the right lens. Your garden is a community. A plant needs the right light niche to hold its own among neighbours.
A note on trees: Ellenberg scored trees based on their juveniles. A mature oak stands in full sun, but it spent its youth in shade. We distinguish shade-tolerant seedlings from sun-loving adults in our encyclopedia.
From Ellenberg to EIVE
Ellenberg's original values covered Central European plants. Over decades, botanists across Europe created regional systems. In 2023, 34 scientists harmonised 31 of these into EIVE — Ecological Indicator Values for Europe — covering 14,835 species with continuous-scale light values.
We use EIVE-L as our foundation. For species outside the dataset, we use machine-learning imputation from related species and shared traits.
How We Model Shade in Your Garden
Ellenberg measured light as a percentage of open sky. We simulate where shadows fall and estimate how much sunlight each spot receives.
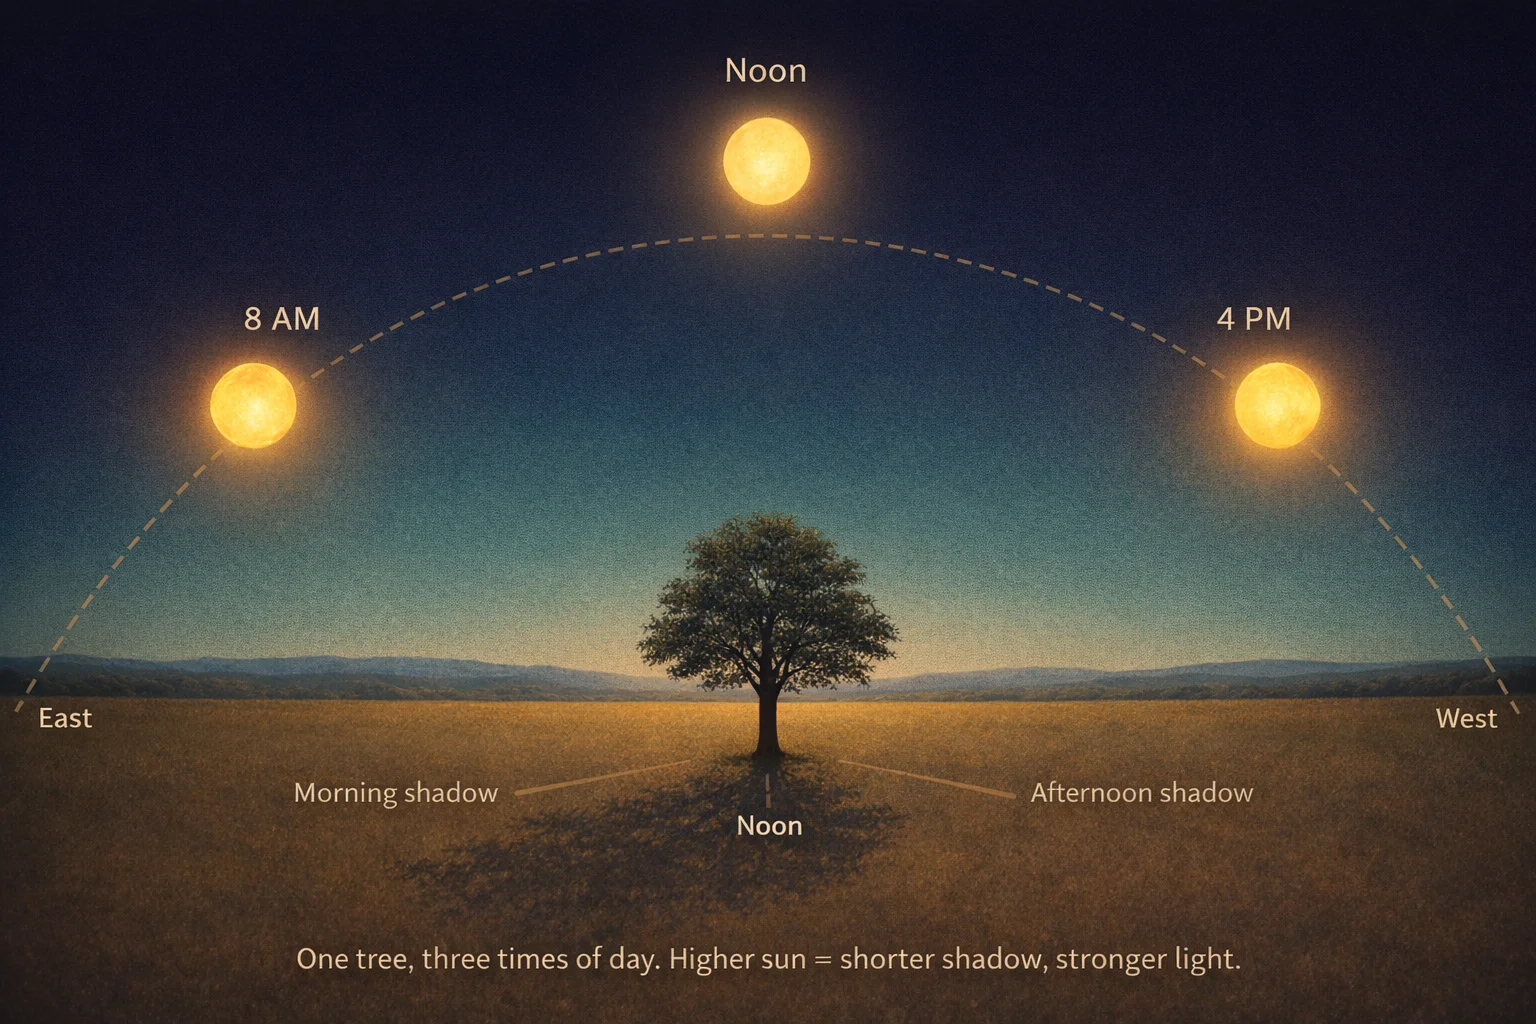
Track the sun
For your exact latitude, we calculate the sun's position every 30 minutes — compass direction and altitude — for a representative day in each season.
Cast shadows
Each tree and structure shades the garden according to its height, width, density, and the sun's angle. Taller and wider objects block more sky, denser canopies cast darker shade, and low sun throws those shadows further across the garden.
Weight by intensity
Midday sun is far more intense than dawn. We weight each half-hour by sun altitude, so losing noon shade counts ~6× more than early morning.
Match the plant
The resulting percentage maps onto Ellenberg's scale. 60% of full sunlight suits a meadow species (L=7). 3% suits a woodland fern (L=2).
Four Practical Light Bands
Hill's literature categories are richer than most garden interfaces need. For practical placement, we use a four-band bridge: shade, semi-shade, half-light, and sun.
The cutpoints are chosen from Hill's anchor percentages at the dim, middle, and bright ends of the scale: shade plants mostly below 5% and seldom above 30%, semi-shade plants generally above 10%, and light-loving plants rarely below 40%. (Hill et al. 1999)
| Practical Band | Relative Light | Linked Hill Classes | Why This Split |
|---|---|---|---|
| ☁ Shade | < 10% | L = 1–3 | Keeps the deep-shade end below Hill's >10% semi-shade anchor, while covering Hill's L3 shade plants.(Hill et al. 1999) |
| ◒ Semi-shade | 10–30% | L = 4–5 | Starts where Hill says semi-shade plants are generally above 10%, and ends at the 30% upper edge Hill still associates with shade.(Hill et al. 1999) |
| ◐ Half-light | 30–40% | L = 6–7 | A practical transition band between Hill's 30% shade ceiling and 40% light-loving floor.(Hill et al. 1999) |
| ☀ Sun | > 40% | L = 8–9 | Starts where Hill says light-loving plants are rarely found below 40%; the brightest end of this band approaches full-light species.(Hill et al. 1999) |
☁ Shade
Deep-shade through Hill's L3 shade plants: the darker end of the gradient.
◒ Semi-shade
The shadier middle, anchored by Hill's semi-shade plants with generally more than 10% light.
◐ Half-light
Bright partial shade to well-lit positions: our practical bridge for the L6–7 zone Hill describes verbally.
☀ Sun
Starts at Hill's 40% light-loving threshold; the brightest end approaches L9 full-light plants.
What We Can't Model
Shadow modelling catches the big mistakes — a tomato behind a north-facing wall, a shade fern in full exposure. Getting the big calls right matters more than simulating every photon.
Further Reading
Ellenberg, H. et al. (1991). Zeigerwerte von Pflanzen in Mitteleuropa. Scripta Geobotanica 18: 1–248.
Ellenberg, H. & Leuschner, C. (2010). Vegetation Mitteleuropas mit den Alpen in ökologischer, dynamischer und historischer Sicht. Ed. 6. Ulmer, Stuttgart.
Chytrý, M., Tichý, L., Dřevojan, P., Sádlo, J. & Zelený, D. (2018). Ellenberg-type indicator values for the Czech flora. Preslia 90: 83–103.
Hill, M. O. et al. (1999). Ellenberg's indicator values for British plants. ECOFACT Vol. 2a. Institute of Terrestrial Ecology.
Dengler, J. et al. (2023). Ecological Indicator Values for Europe (EIVE) 1.0. J. Veg. Sci. 34: e13168.